
# Project detail
When clicking a project in the list, it will be shown the selected project detail page.
When clicking the "Back" icon on the project detail page, you can go back to the project list page.
- Please refer to here for the "Predictive detection model" button on the project detail page.
- Please refer to here for the "Profile trend" button on the project detail page.
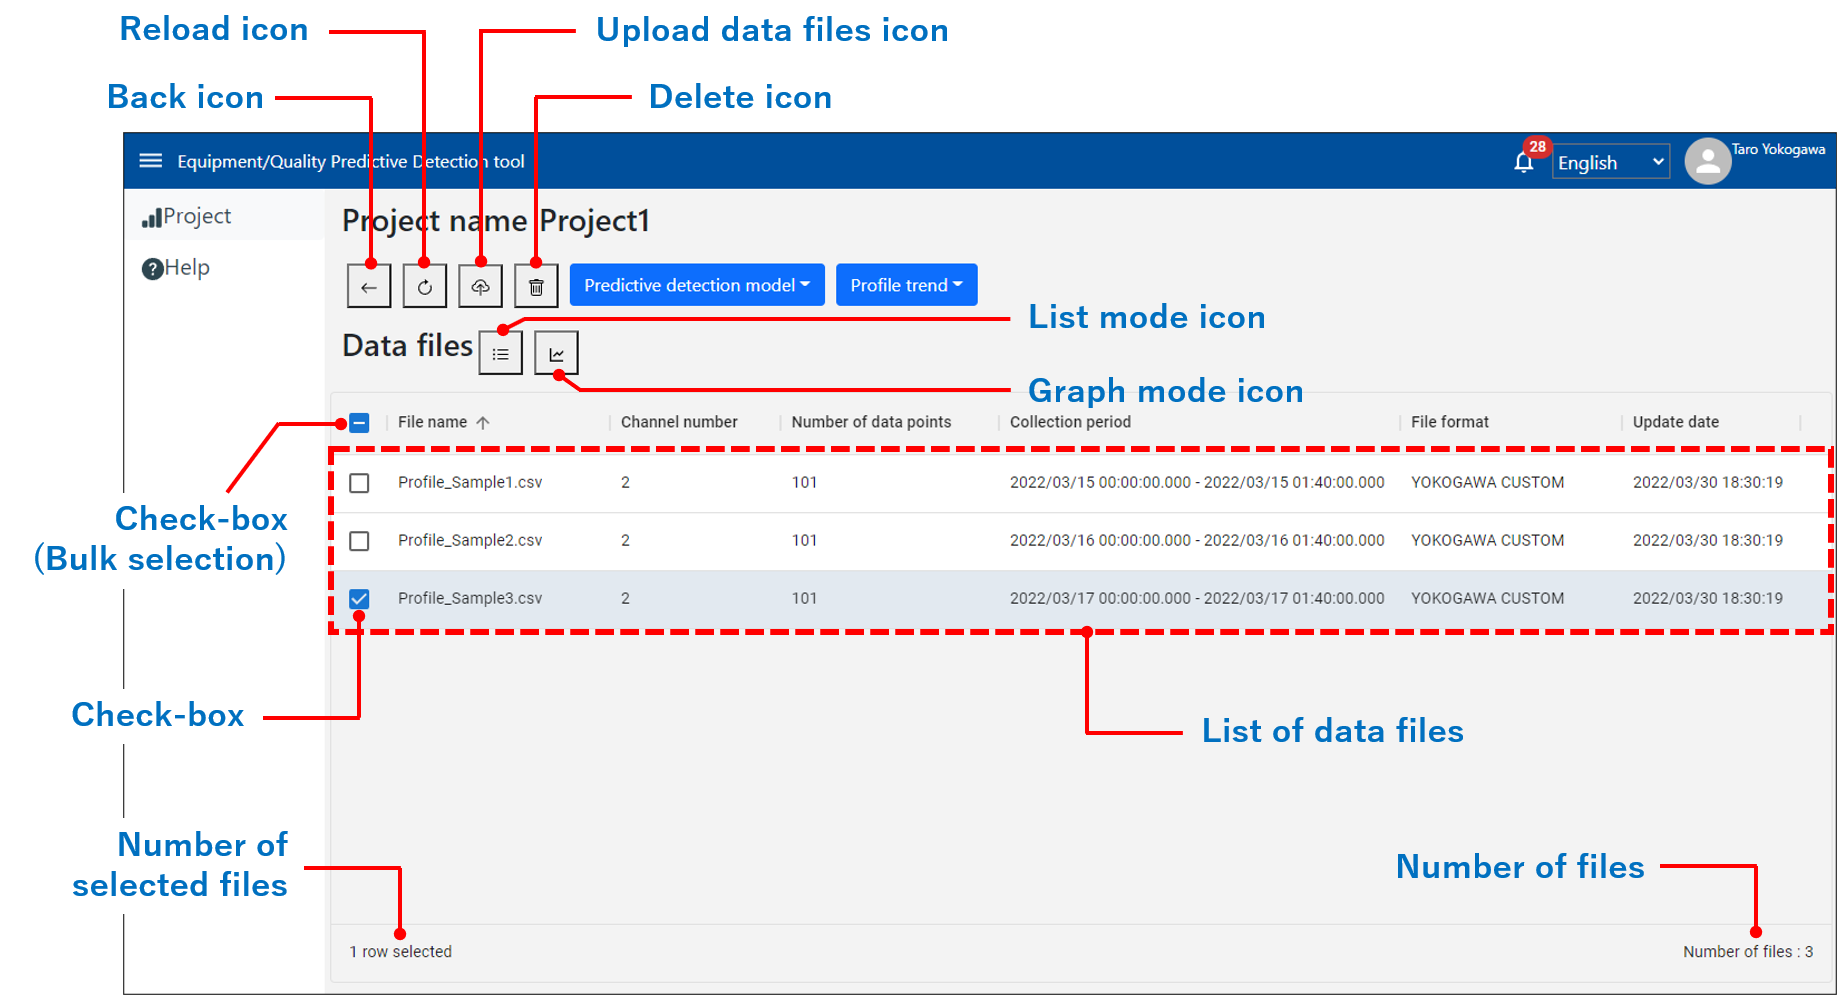
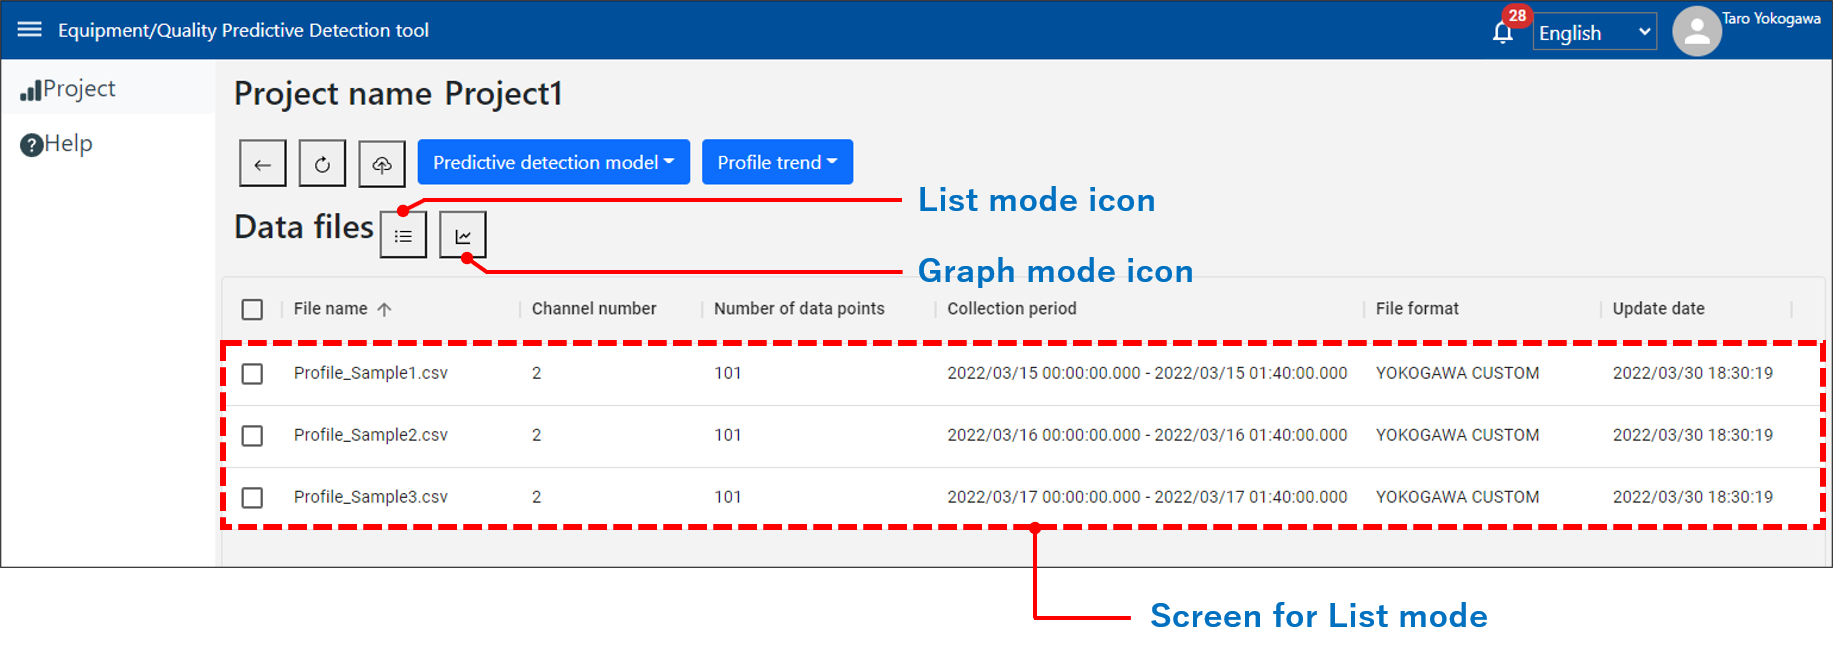
The information shown in the data files list (List Mode)
| No. | Items | Descriptions |
|---|---|---|
| 1 | File name | Name of the data file |
| 2 | Channel number | The number of channels contains in the data file |
| 3 | Number of data points | The number of data points in each channel of the data file |
| 4 | Collection period | Collection period of data |
| 5 | File format | The name of the data file format |
| 6 | Update date | Data file uploaded date or creating date by trimming (editing graph) data |
| 7 | Number of selected files | The number of data files with check-boxes selected |
| 8 | Number of files | The number of all data files in the project |
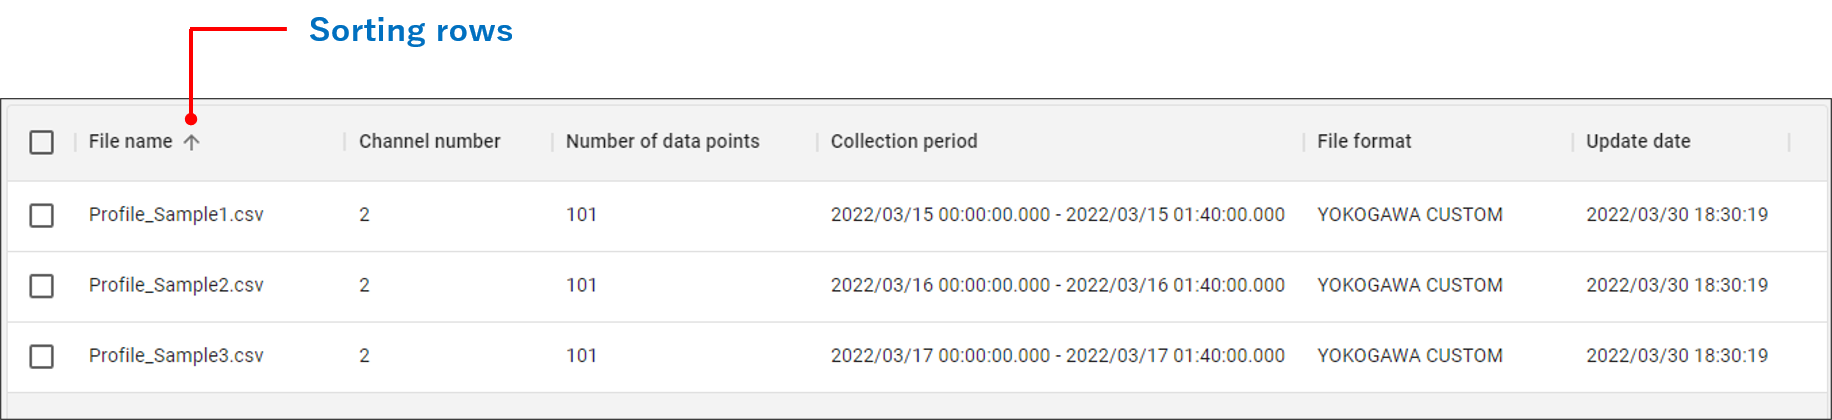
Note:
You can sort each item of the data files which have been created.
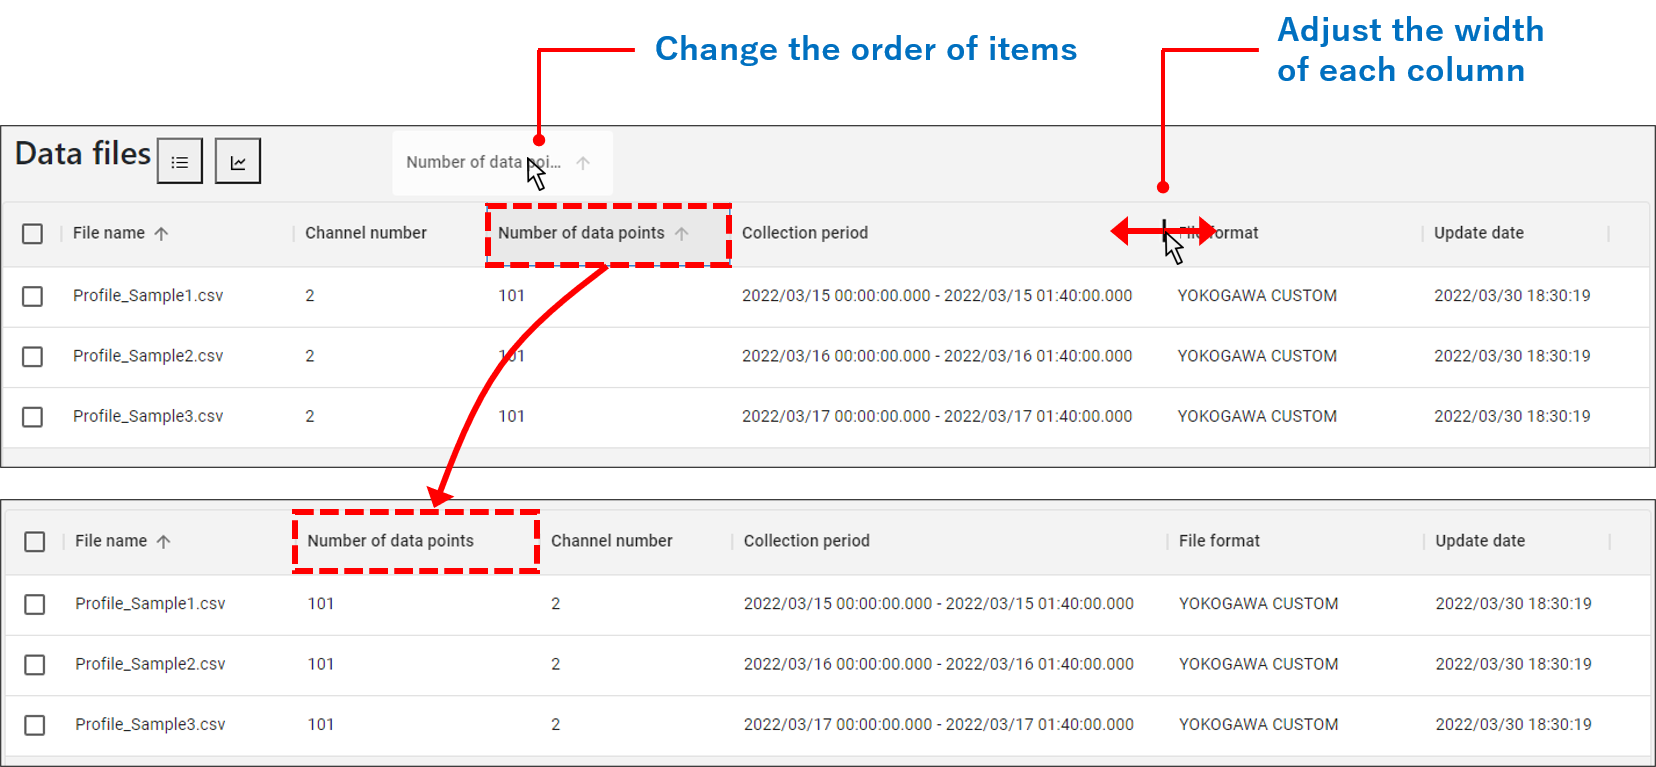
Also, you can change the order of items and adjust the width of each column with drag-and-drop of mouse operation.
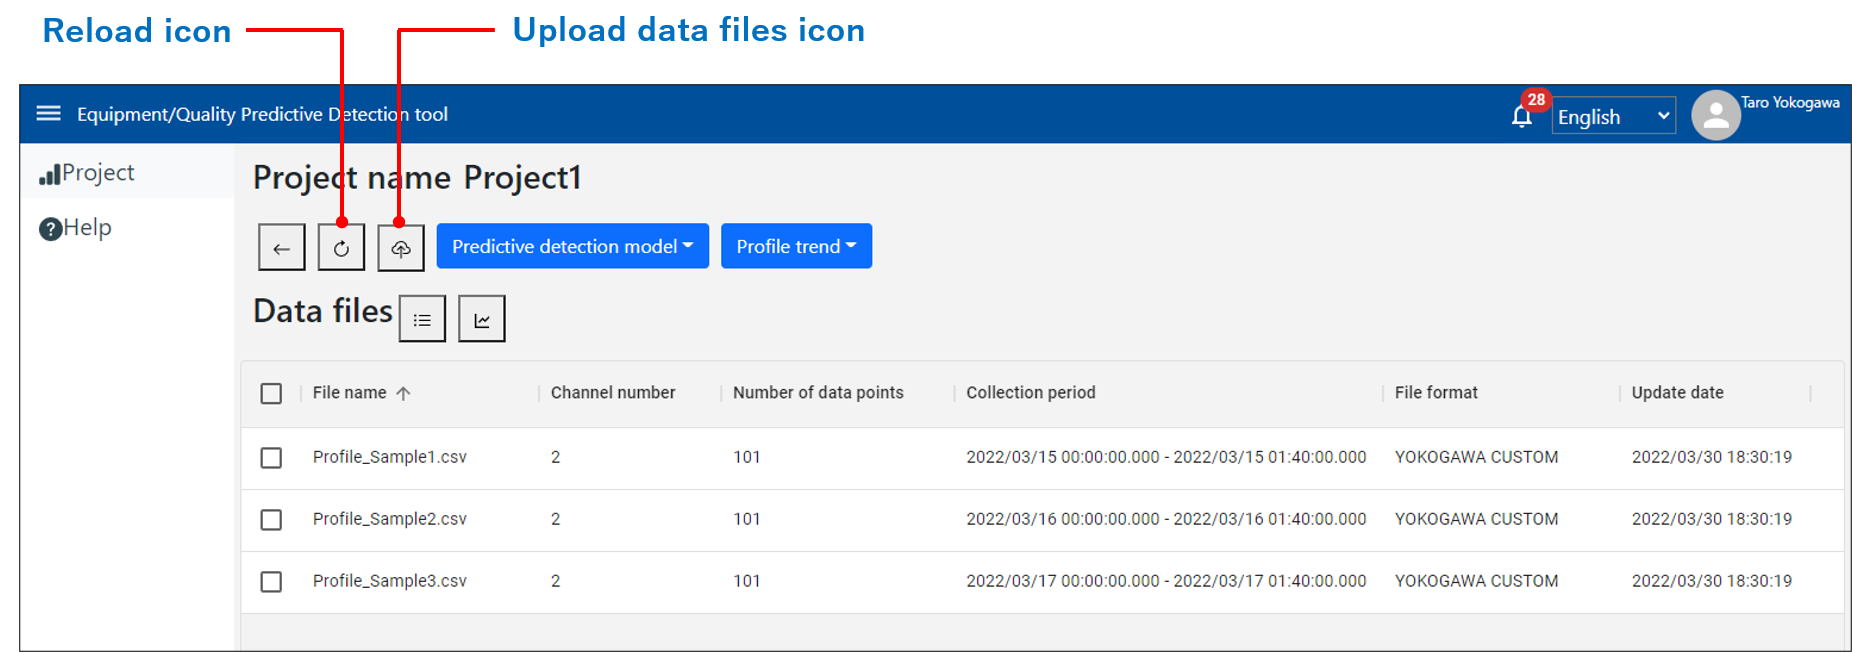
# Upload data files
When clicking the "Upload data files" icon, you can select the file you want to upload.
Uploaded files can be multiply selected.
After completion to upload files, the message which represents added the files on the Notification.
Then, clicking the "Reload" icon, it will be shown the uploaded files in the data files list.
Note:
- Up to 50 data files can be uploaded for every project.
- Please see here for uploadable data files.
- If the number of uploaded data files or the number of channels of uploaded data files is large, the operation may become slow when switching the display mode of data files and enlarging/editing the graph which will be described later.
# Switching data file display mode
When clicking the "List mode" icon, you can switch to the "List Mode" for detail information of data files.
When clicking the "Graph mode" icon, you can switch to the "Graph Mode" to be shown the graphs of data files.
# Screen in the "List Mode"
# Screen in the "Graph Mode"
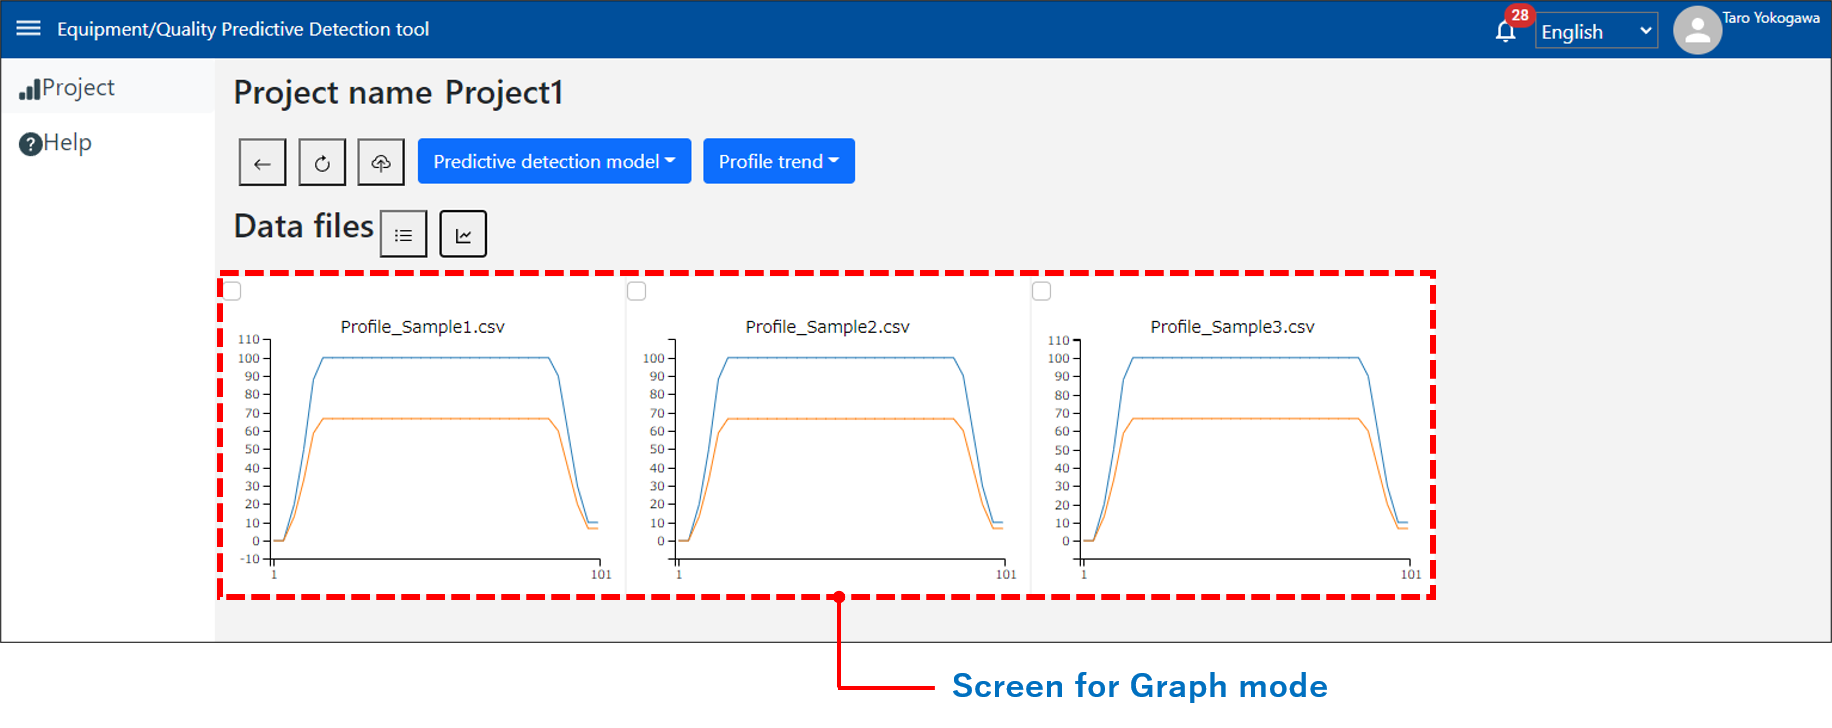
Note:
The number of data points in each channel of the data file is greater than 50, the graphs will be shown by thinning out automatically.
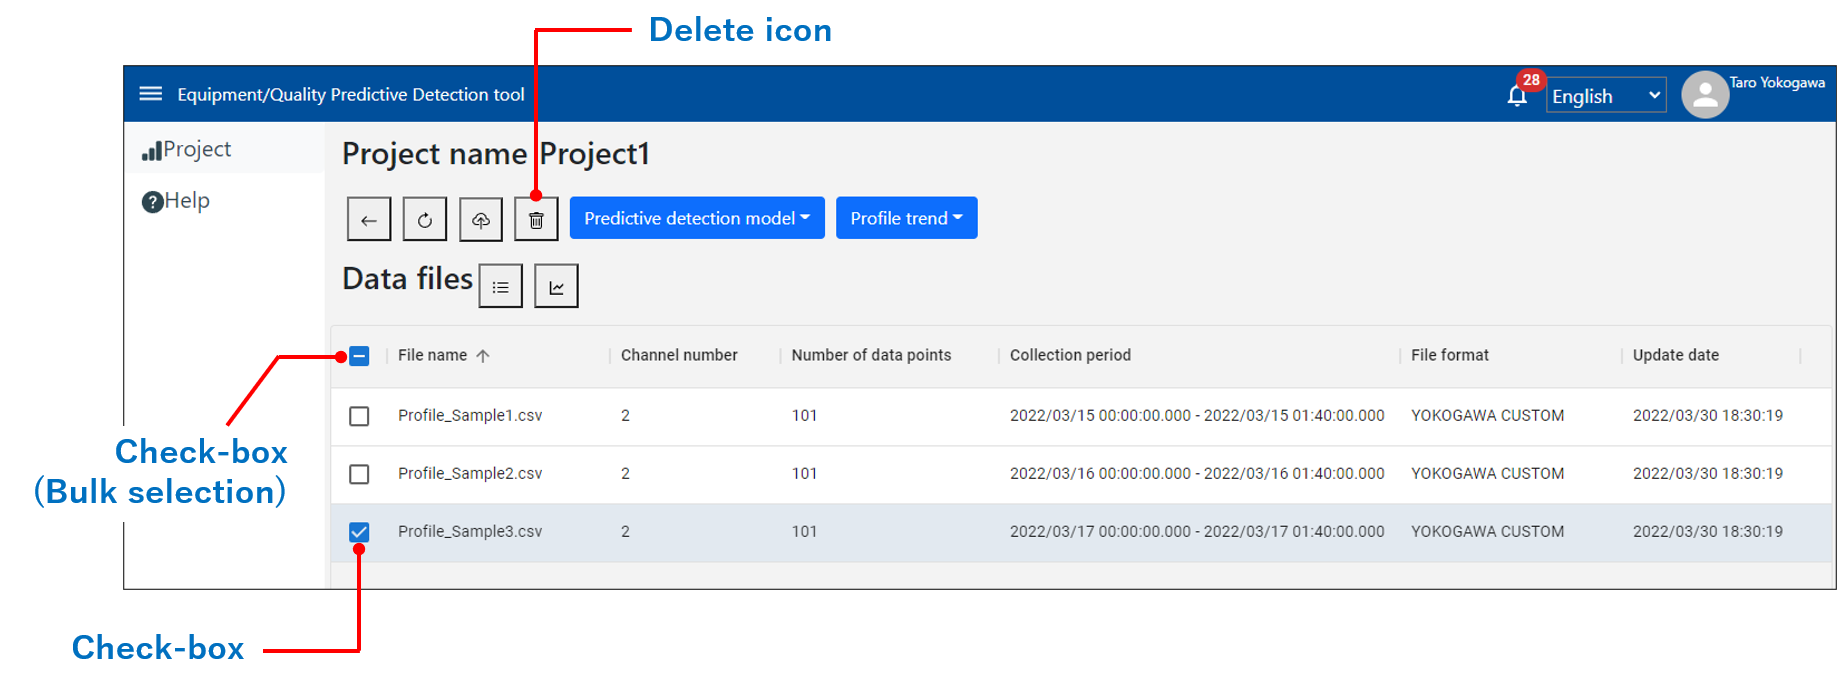
# Delete data files
When checking the one or more check-boxes of the data files list, it will be shown the "Delete" icon.
In this state, when clicking the "Delete" icon to display a dialog and click OK, you can delete checked data files.
By the check-box for "Bulk Selection", you can also select all data files at once.
# Enlarging graph
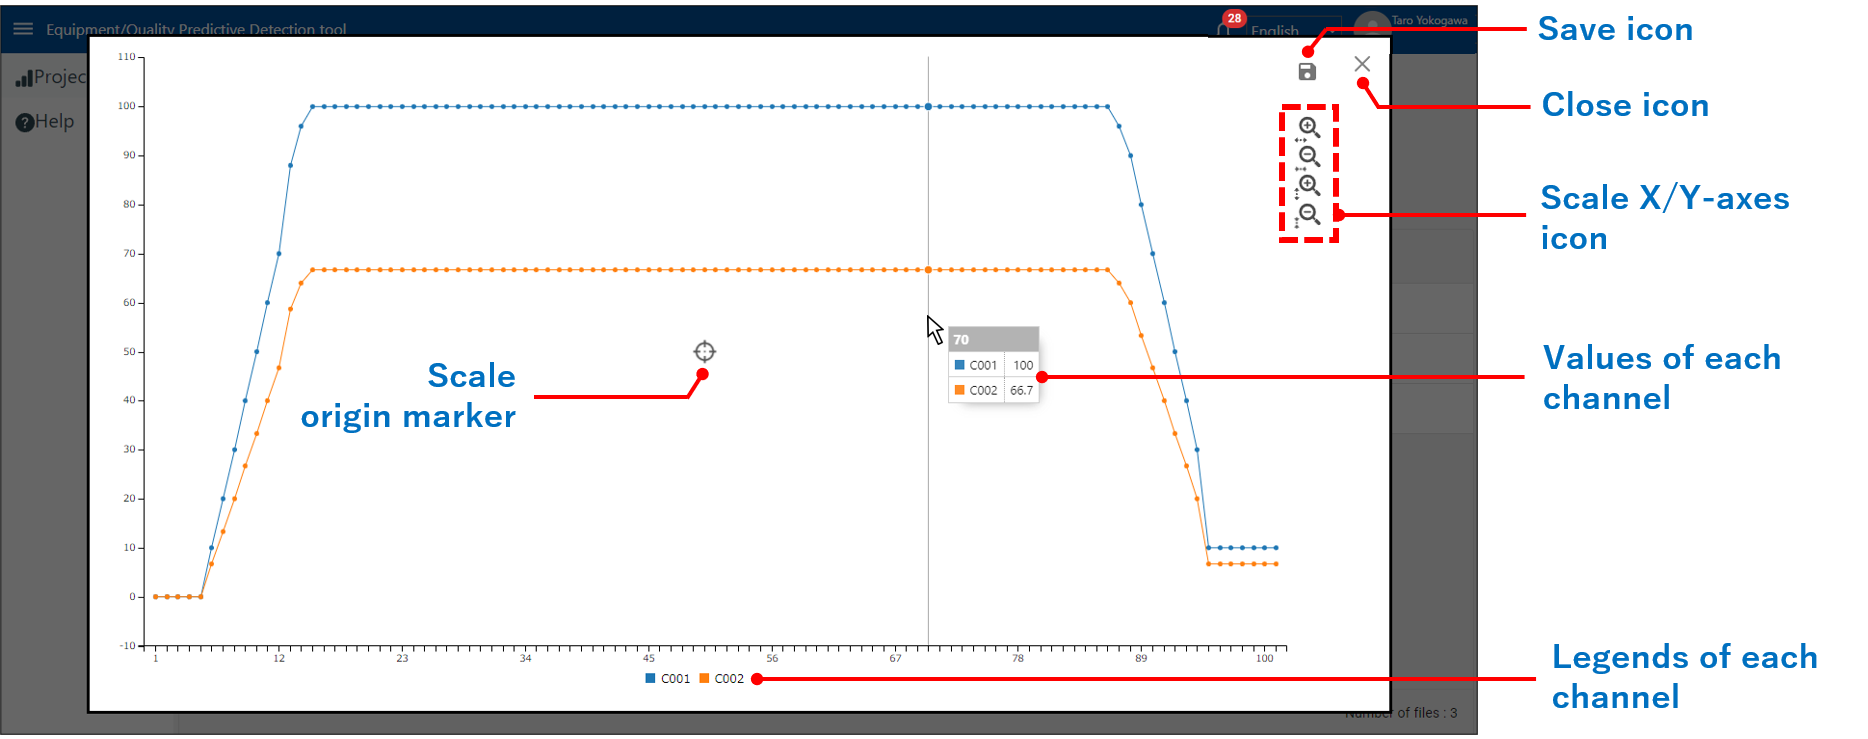
When clicking the file in the project list, it will be shown the enlarged graph of the selected file.
In the state of showing the enlarged graph, when clicking the "Close" icon, you can go back to the data files list page.
By hovering the mouse cursor over the graph, it will be shown the value of each channel.
By clicking legends of the graph, you can switch to display/hide the graphs and their values of each channel.
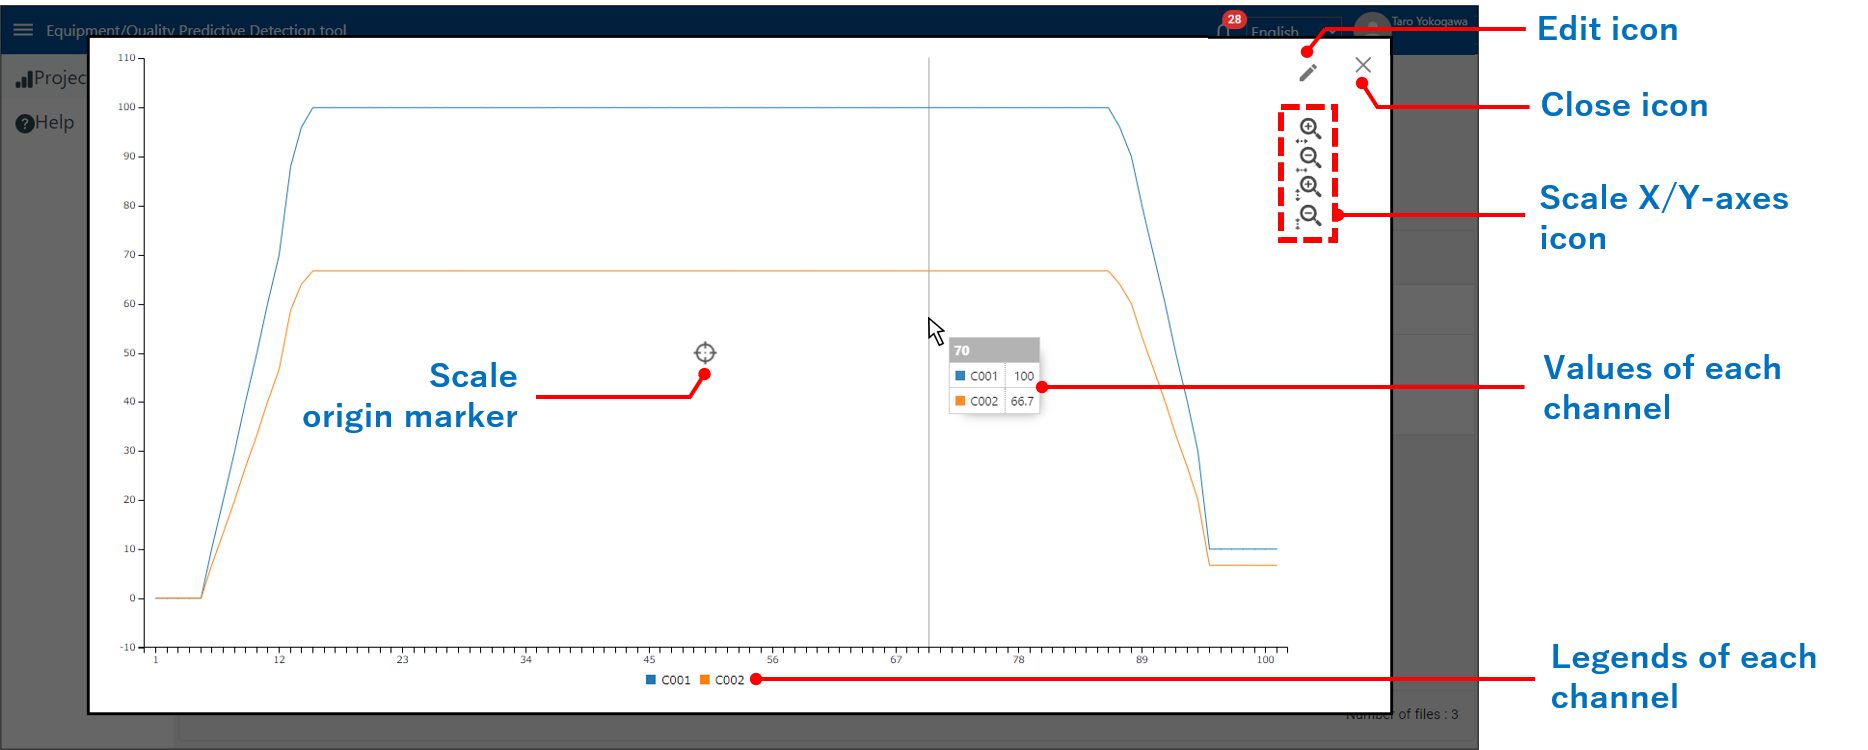
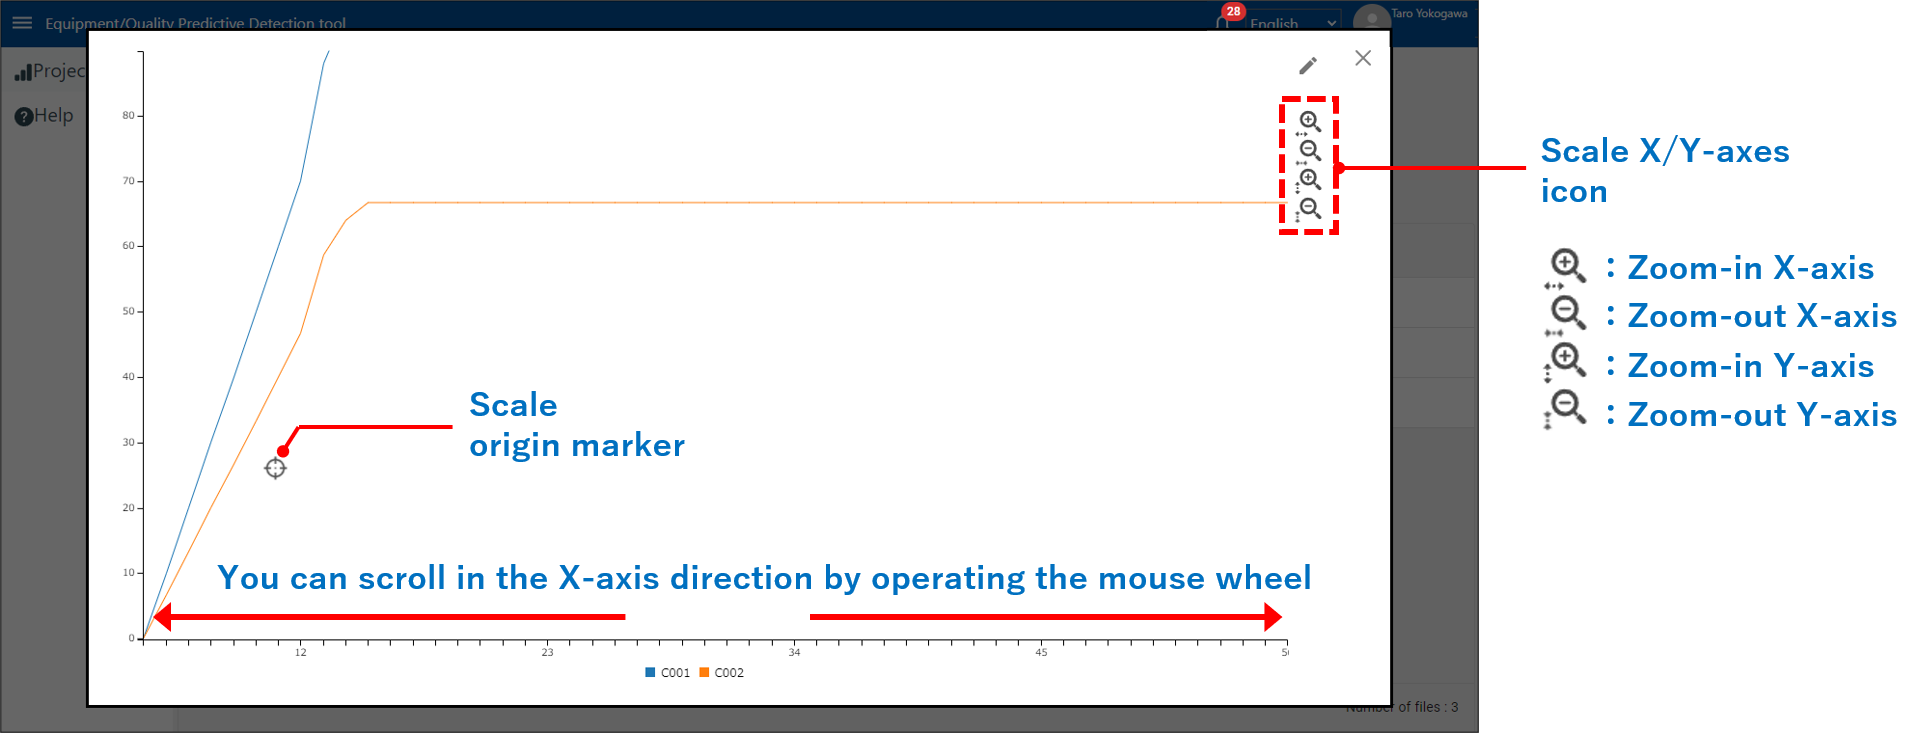
By clicking the "Scale X/Y-axes" icon on the enlarged graph screen, you can scale to X/Y-axes directions at the center of the origin marker.
The position of origin marker can be moved by clicking on the graph.
Also, you can scroll in the X-axis direction by operating the mouse wheel while enlarging to the X direction.
Note:
- The number of data points in each channel of the data file is greater than 300, the graphs will be shown by thinning out automatically.
- You can click zoom-in scale icons up to 4 times on each of the X-axis and Y-axis.
# Edit graph
When clicking the "Edit" icon, it will be switched to "Edit graph" mode.
In the "Edit graph" mode, you can trim the specified range of the data file and save the trimmed data as a new data file.
Even in the "Edit graph" mode, you can do the following operation.
・Display the value of each channel
・Display/hide the graphs and the values of each channel (click on the legend)
・Scaling to X/Y-axes directions
・Scrolling the display range in the X-axis direction
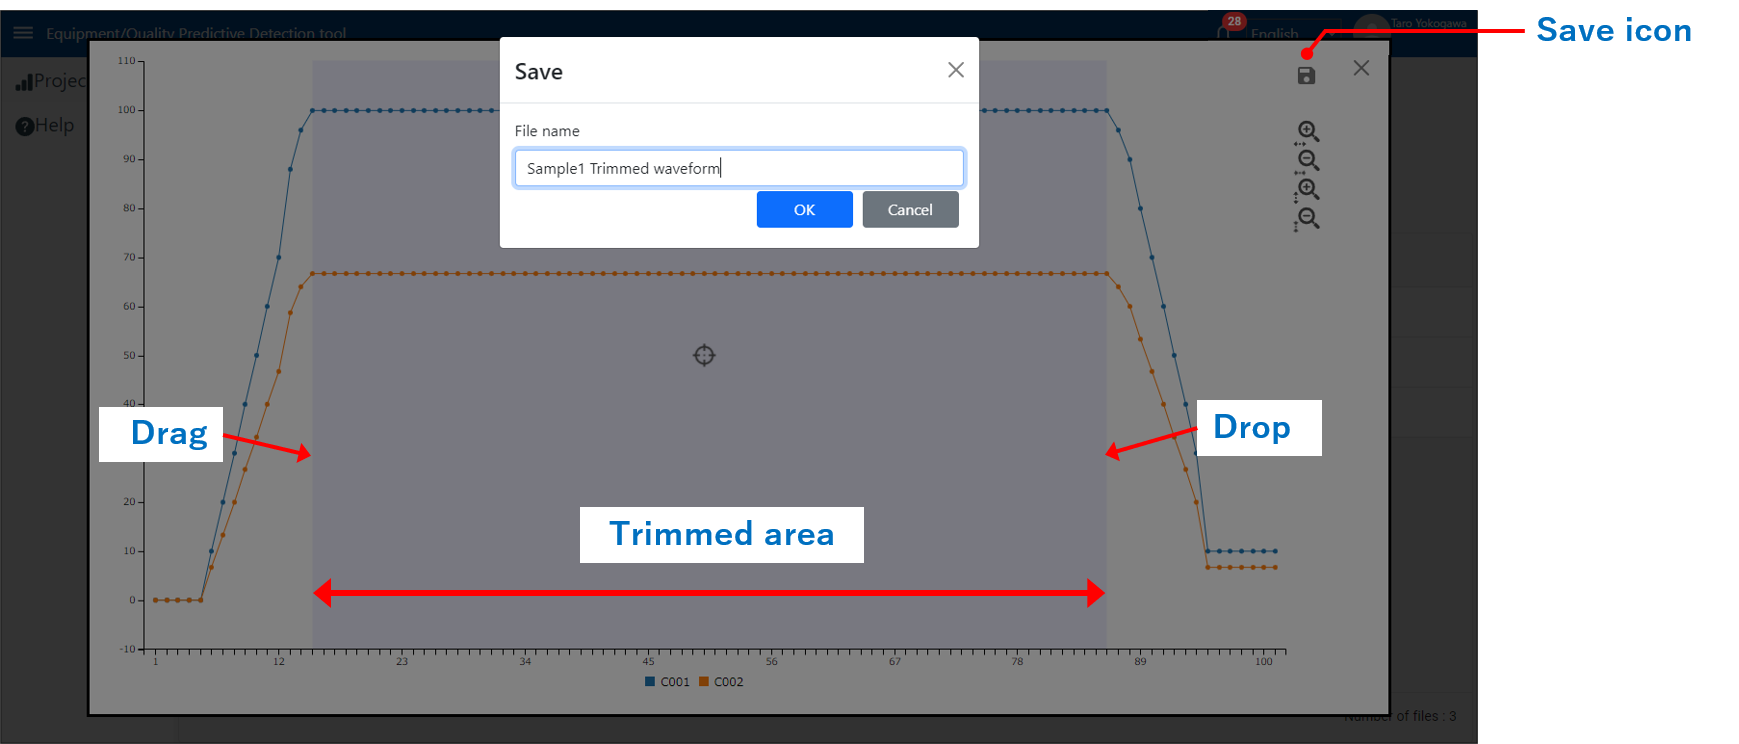
When performing the drag-and-drop of the mouse operation on the graph, the color will be changed in the specified area, you can specify the trimmed area of the data.
You can change the trimmed area by dragging-and-drop it again on the graph.
When clicking the "Save" icon during specifying the trimmed area, it will be shown the "Save data file" dialog.
By clicking the OK button after entering a file name, you can save the trimmed data as a newer data file.
Note:
- The file name is editable for up to 256 characters.
- If there have been already 50 files in the project, the trimmed data will not be able to save.
- The number of data points in each channel of the data file is greater than 300, the graph will be shown by thinning out automatically. So the start/end-point that you want to trim may not be shown.
In this case, trim the data to 300 points or less, save it as a new data file, and trim the data again to the saved data file.
Note:
- The following symbols and names are not available for the file names.
- Symbols that are not available: Symbols prohibited for Windows (\ / * : ? " < > |)
- Names that are not available: Reserved words for device names such as:
"AUX", "CON", "PRN", "NUL", "CLOCK$",
"COM0", "COM1", "COM2", "COM3", "COM4", "COM5", "COM6", "COM7", "COM8", "COM9",
"LPT0", "LPT1", "LPT2", "LPT3", "LPT4", "LPT5", "LPT6", "LPT7", "LPT8", "LPT9"
(It is available if you use it in combination with other characters such as AUX0.)